

Growth is the answer to most problems. That's the standard advice, and it's wrong often enough to be dangerous. A firm can add a fifth to turnover in a year and finish it with profit flat, because the new sales carried deeper discounts, heavier servicing and slower payment than the ones they replaced.
For a UK company turning over £1 million to £15 million, two controls catch that failure early. Product profitability analysis works out what each product or SKU really keeps after every cost that follows the sale. Customer profitability analysis does the same for each account, including the discounts, returns, delivery and support it consumes. Neither is a reporting exercise. Both tell you which sales deserve more of your capacity and which are buying it with your cash.
By the end of this piece you'll be able to rank products and accounts by contribution rather than turnover, and name the ones that need attention before your next pricing round.
Why Turnover Growth Can Hide Weak Margins
Turnover growth is treated as proof of health, yet it's the weakest evidence available. Say a company with £2.4 million of turnover wins £400,000 of new sales in a year, and profit barely moves. The new orders arrived with deeper discounts, heavier servicing and slower payment than the business they replaced. Nothing on the sales report flags it, and the blended margin still looks respectable.
The Office for National Statistics shows how much a healthy average can conceal across the wider economy. The mean profit margin of businesses in the UK non-financial sector rose from 13.0% in 1997 to 15.1% in 2022, but the ratio of the 90th-percentile profit margin to the median climbed from 4.22 to 5.84 across the same period. In 2022 the 90th-percentile margin reached 50.2%, against 48.8% in 2021, even as margins fell across most of the rest of the distribution. The average rose while the spread widened.
That same dispersion repeats inside a single company. A sound blended margin can sit on top of product lines, contracts and accounts that consume cash and capacity without returning their share.
The marketing equivalent of this argument is well made in the POAS vs ROAS breakdown from Product Metrics, which sets out why a profit-adjusted return tells you more than one built on revenue alone. Move that logic from ad spend to a product line and you have product profitability analysis.
Revenue, Gross Margin and Contribution Margin Compared
Run one £100 net sale through four measures and the difference between them stops being academic.
| Measure | What it deducts | Example on a £100 net sale | Question it answers |
|---|---|---|---|
| Turnover | Nothing deducted | £100 (100%) | Is demand growing? |
| Gross margin | Cost of goods sold: materials and direct labour | £55 (55%) | Is the product costed correctly? |
| Contribution margin | Volume-sensitive costs: fees, delivery, commission, packaging | £40 (40%) | How much does each extra sale add to fixed costs? |
| Operating margin | Allocated overheads and fixed costs | £15 (15%) | Does the product earn its share of overhead? |
Turnover is the starting point and shows demand, not profit. Gross margin deducts cost of goods sold, meaning materials and direct labour, and leaves £55. Contribution margin also deducts every cost that rises with each sale: payment fees, delivery, commission, packaging. That leaves £40 before a single fixed cost. Operating margin then absorbs allocated overhead and lands at £15.
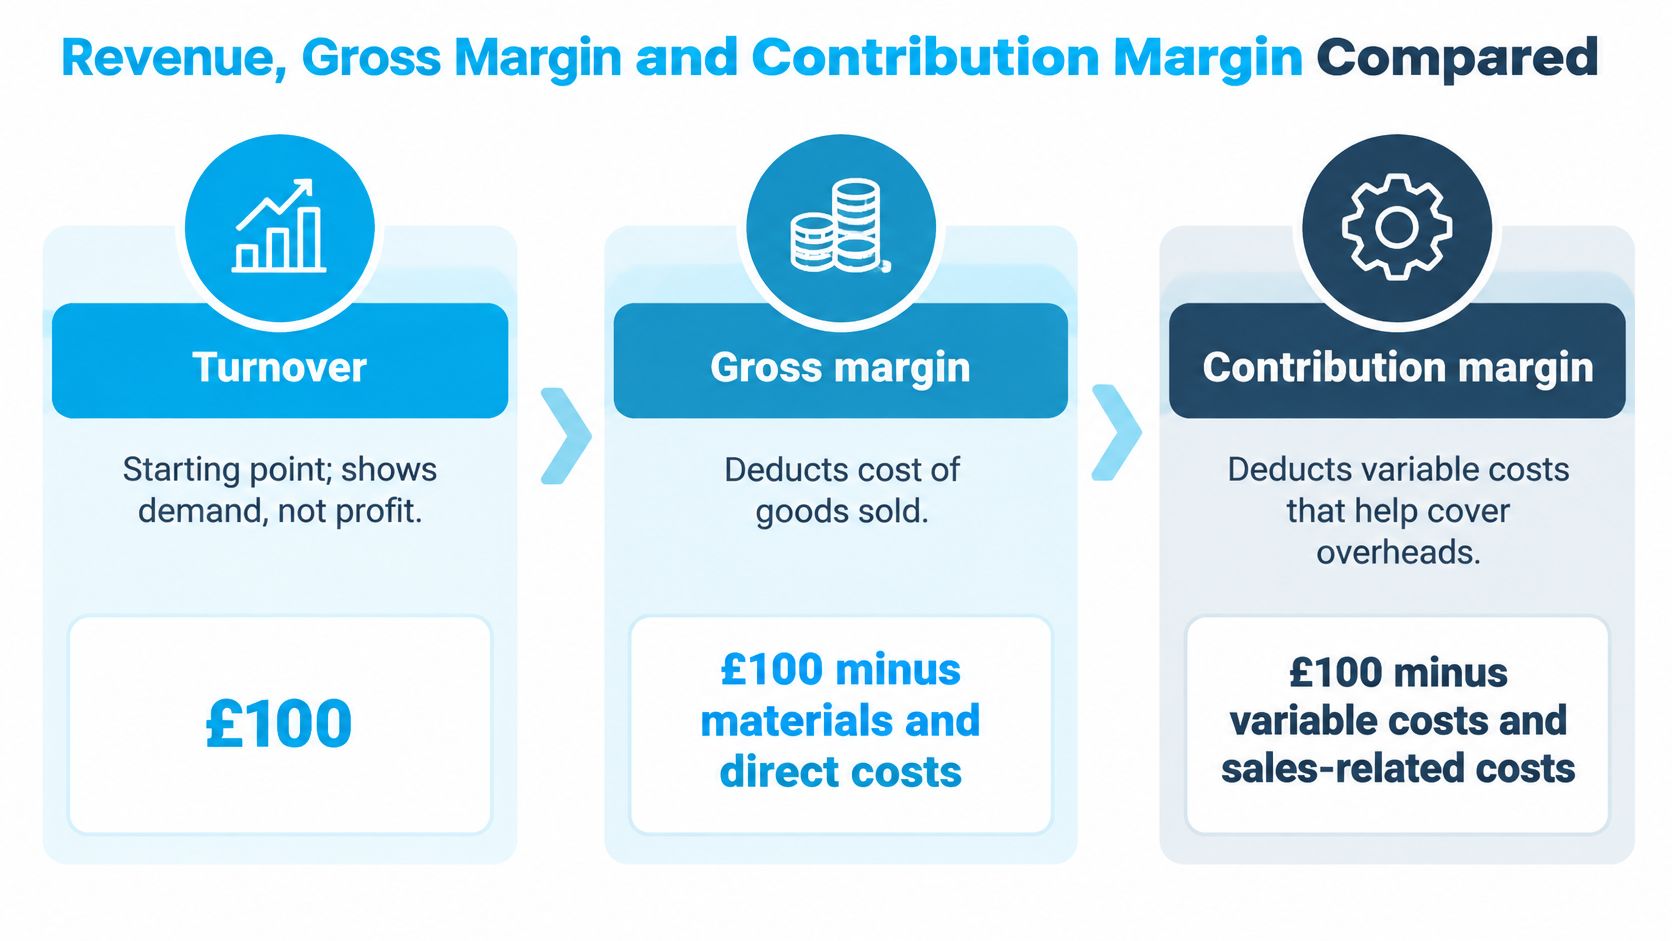
Contribution margin is the figure for short-term decisions on discounts, minimum order values and product mix, because it shows what each extra sale adds towards fixed costs and profit. Gross margin flatters product choices by ignoring the costs that scale with volume, so two products with identical gross margins can contribute very different amounts.
Practical rule: If a decision changes this month, judge it on contribution. If it changes the shape of the business for three years, judge it on operating margin.
Clean cost data is the prerequisite. The guide to organising receipts by expense category from Snyp covers the bookkeeping discipline that keeps fee, freight and packaging costs separable at product level.
How to Run a Product Profitability Analysis
Work through the model in this order and the output survives a challenge from the board. Skip a step and the ranking flips.
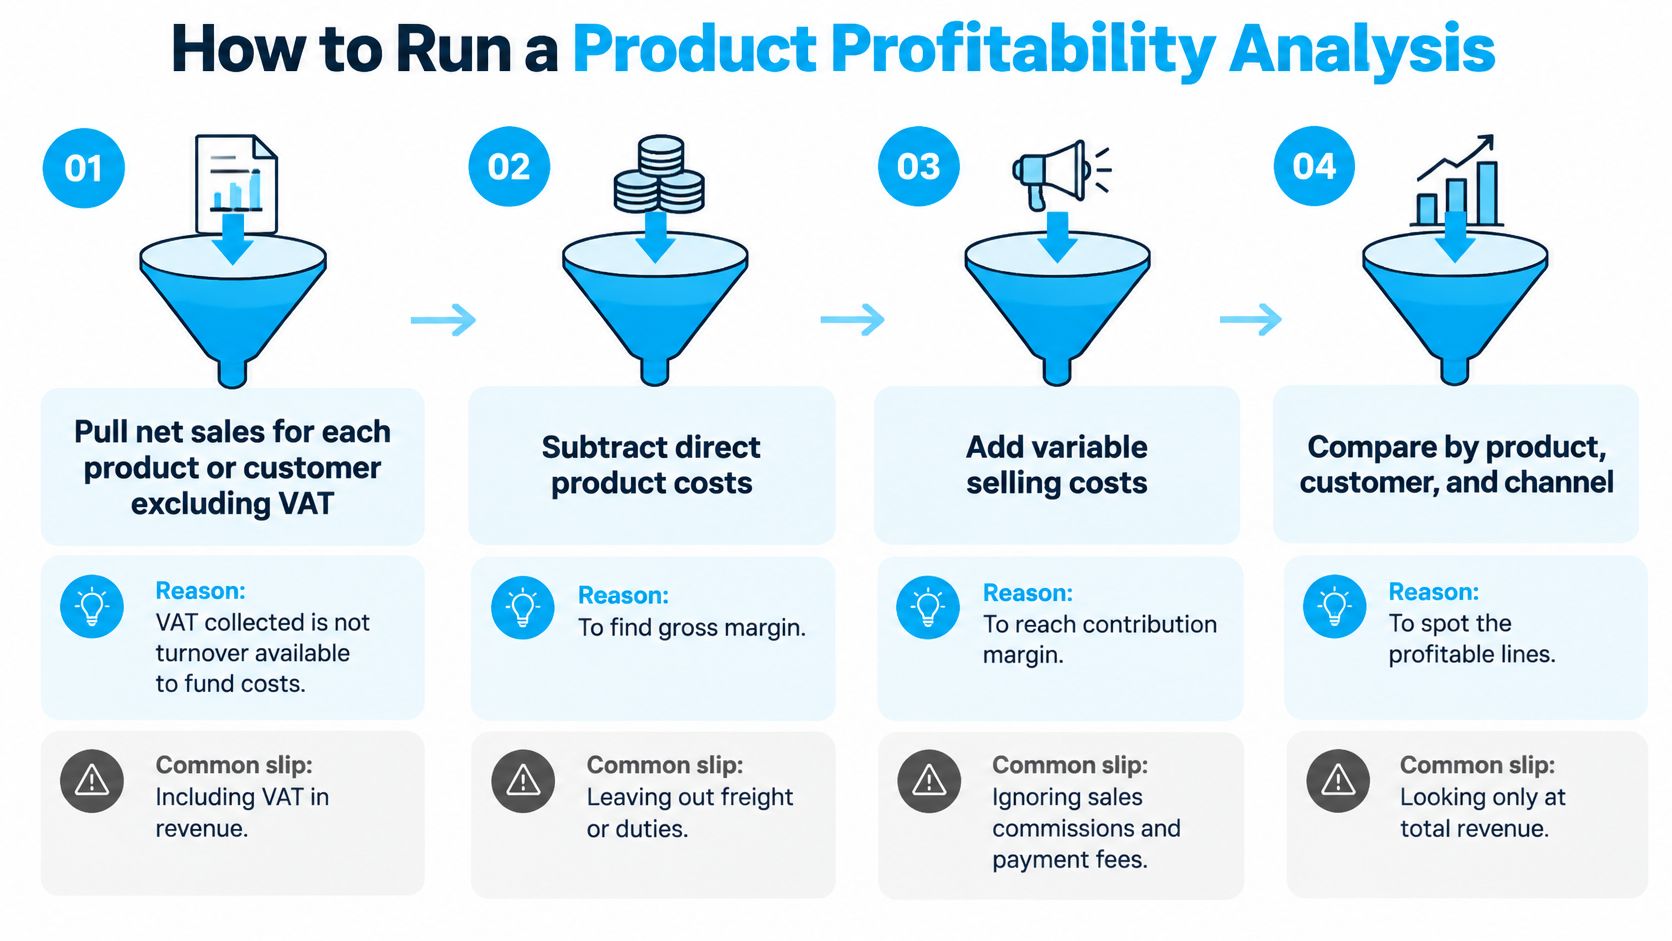
Pull net sales excluding VAT. VAT collected isn't turnover available to fund margin. At the 20% standard rate, a £120 VAT-inclusive price is £100 net, and only the £100 is working capital for the business.
Tag every variable cost to its product. Materials, packaging, transaction fees, delivery, commission and direct labour. The common slip is leaving out payment fees and returns, which can be several points of margin on their own.
Calculate contribution, then contribution per constrained resource. Contribution per machine hour, labour hour or delivery slot, rather than per unit. The highest percentage margin often belongs to the product that eats the most bottleneck capacity, so it earns least where capacity is scarce.
Allocate activity costs by driver. Set-ups, order handling and account management should follow actual use, rather than an even split across lines.
Deduct fixed overhead to reach operating profit by product, and reconcile the total back to your management accounts. Split avoidable fixed costs, such as a dedicated machine lease or a line-specific supervisor, from shared costs that continue regardless; only the avoidable portion belongs in a keep-or-drop decision.
Set break-even volume. Fixed costs divided by contribution per unit. £60,000 of fixed costs at £40 contribution needs 1,500 units.
Re-run monthly with scenarios. Price changes, supplier inflation, discounting and volume mix. UK producer input prices rose 5.4% year on year in March 2026 while output prices rose only 2.6%, a 2.8 percentage point squeeze that historic product margins won't show, according to ONS producer price data.
A product with positive contribution that doesn't cover its share of fixed costs needs a repricing or fix test before any closure decision.
Monthly reporting is what turns this from a project into a control, and monthly management accounts give the variance detail the model needs. If supplier and bank data arrives as statements rather than ledger lines, this walkthrough on how to build pivots from bank statements from BankStatementWizard saves a day of manual rekeying.
Where Customer Profitability Analysis Finds Costly Accounts
Consider a manufacturing firm where one account delivers 22% of turnover and looks like the best relationship on the books. It takes a 9% trade discount, places frequent small orders and returns stock regularly. On a contribution report the same account earns an 11% contribution margin against a company average of 38%. Discounts, returns and handling have turned the star account into a problem, and no sales report would have said so.
The pattern repeats by sector. A distributor finds a high-volume line earning 4% after pallet-level delivery. An e-commerce brand discovers that a free-shipping threshold plus a 25% return rate makes its bestselling line loss-making on some orders. A professional services firm sees a retainer client absorbing partner hours and pulling contribution per chargeable hour below the firm average.
None of this surfaces in a revenue ranking.
Margin and return test different things. The ONS profitability bulletin recorded a 7.3% net rate of return for manufacturing companies in April to June 2024, against 7.2% in January to March, while UK private non-financial corporations overall achieved 8.8% in the second quarter of 2024. A product can show a healthy gross margin and still earn a weak return once production assets, stock, warehousing and warranty are counted.
Apply the same test to channels, comparing contribution after platform fees, commission and delivery with the same product sold direct.
Three questions expose most of it:
Which customers buy below average price? Discount depth by account, not by product.
Which orders cost more to serve? Small drops, bespoke requests, high return rates.
Which lines tie up stock or cash longest? Slow-moving inventory and extended payment terms.
High turnover and low contribution coexist constantly, because sales reports rank accounts by what they bill rather than what they consume. The usual fix is repricing, a minimum order value or a change to servicing terms. Where the hours, warehouse space or credit an account absorbs could earn more elsewhere, the relevant comparison is contribution per unit of that constraint, and exit becomes a last resort rather than the default.
Why Cost Allocation Can Change the Answer
Direct costs can be traced to a product without judgement. Indirect costs need a driver, and the choice of driver decides who looks expensive.
Take a £120,000 overhead pool shared between three lines. Product A is the small-batch line with 10% of revenue (£30,000 of £300,000), 30% of orders (600 of 2,000) and 40% of machine hours (400 of 1,000). Product B is the bulk line with 60% of revenue, 10% of orders and 20% of machine hours. Product C takes the remaining 30% of revenue, 60% of orders and 40% of machine hours.
| Allocation method | What it shows |
|---|---|
| Revenue share | Product A £12,000, Product B £72,000, Product C £36,000. The small-batch product looks lightly loaded. |
| Machine hours | Product A £48,000, Product B £24,000, Product C £48,000. The small-batch product's share rises fourfold. |
| Order count | Product A £36,000, Product B £12,000, Product C £72,000. The small-batch product's handling burden triples. |
Each method reconciles to the full £120,000, and each tells a different story about the same product. Allocation is a judgement, not a fact, so record the driver chosen and the reasoning behind it.
For keep-or-drop decisions, use avoidable costs. An overhead that stays when a product disappears isn't a reason to keep the product, and it isn't a reason to drop it either. A line carrying overhead may still protect a key customer relationship or a route into a sector, and that judgement belongs in writing rather than buried inside an allocation. Where projects are individually costed, engineering management accounts with job costing show the same principles applied to contracts.
Discounts, Returns and Delivery Costs That Erode Margin
Cut a £100 price to £90 and keep variable cost at £60, and contribution falls from £40 (40%) to £30 (33.3%). Volume must rise by a third just to stand still on total contribution. That is the arithmetic most discount conversations skip.
| Hidden cost | Typical trigger | How to measure it | Worked effect |
|---|---|---|---|
| Trade or volume discounts | Price concessions to win or keep volume | Net price against list price by customer | £100 to £90 cuts contribution margin from 40% to 33.3% |
| Returns | Refunds, restocking and damaged goods | Returns as a share of gross orders per product | 10% of orders returned at £8 handling adds £0.80 to every order |
| Delivery | Free delivery thresholds and small drops | Delivery cost against order value | £6 on a £30 order is 20% of revenue |
| Servicing and support | Bespoke requests and account management | Support hours logged per customer | Every support hour is a productive hour lost |
| Payment terms | Extended credit to win accounts | Days from invoice to cash by customer | 60-day terms hold cash for two months after the invoice |
A £6 delivery charge on a £30 order consumes a fifth of revenue before any product cost is counted. If 10% of orders come back and each return costs £8 to handle, every order carries £0.80 of average handling cost whether it returns or not. Bespoke support and two-month payment terms then tie up staff time and cash that a margin percentage never shows.
Tag every discount, return, delivery charge and support hour to a product or customer code, and review the totals monthly. Where delivery is the dominant variable cost, transport management accounts built around cost per mile put the figure where operations and finance can both see it.
Common Questions About Unprofitable Customers and Products
How do I identify unprofitable customers in my management accounts?
Rank customers by contribution after discounts, returns and servicing, not by turnover. Then examine the bottom group for support hours, small or frequent orders and slow cash collection. Customers with genuine strategic value, such as a reference account or a route into a new sector, should be reviewed rather than dropped, and that judgement should be written down explicitly.
Should I stop selling a product with a low margin?
Not automatically. Check whether the product covers its avoidable costs and contributes towards fixed overhead. If it does, keep it while you test a repricing, bundling or minimum order plan. Exit only when it fails both tests and carries no strategic value to the wider range.
How do I find an unprofitable sales channel?
Compare each channel's contribution after platform fees, commission, returns and delivery with the same product sold direct. High-volume channels with thin contribution often need price changes, minimum order values or a different fulfilment model rather than closure. Review channel results monthly so a slow drift in mix shows up before year end.
Understand What Is Really Driving Your Business Profitability
Two dimensions decide what to do with a line: how much contribution it produces, and how much cash and capacity it consumes.
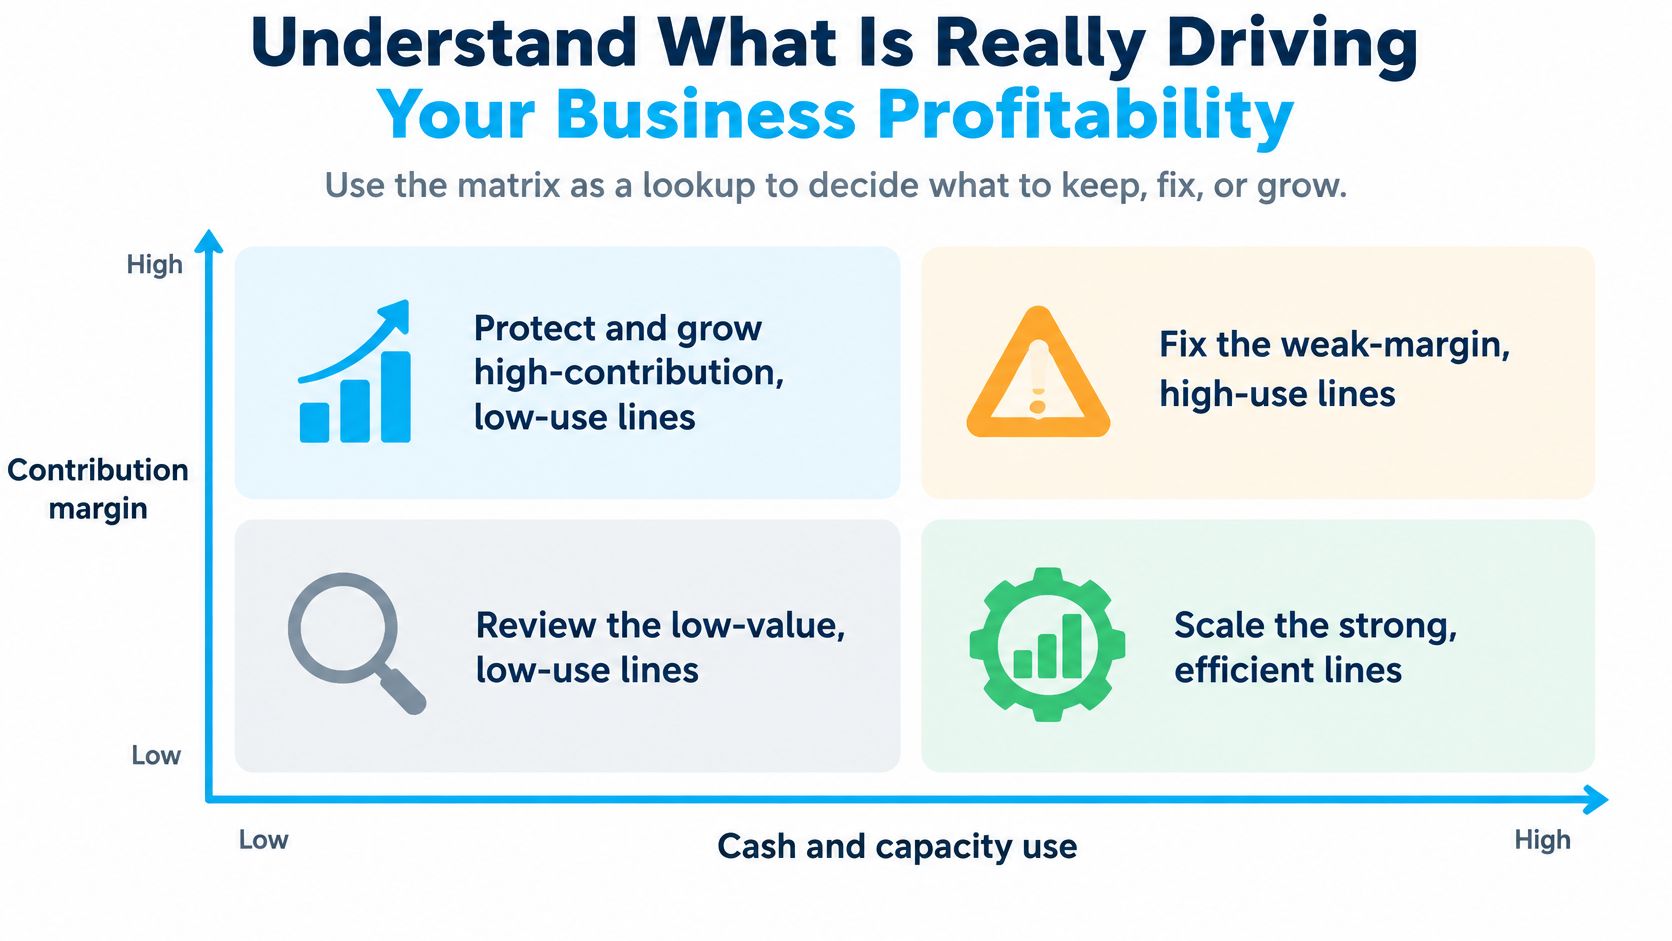
| Contribution margin | Cash and capacity use | Decision |
|---|---|---|
| High | Low | Protect and grow |
| High | High | Fix the constraint or the payment terms |
| Low | Low | Reprice, bundle or add a minimum order |
| Low | High | Redesign, renegotiate supplier costs or exit once avoidable costs and strategic value are checked |
No low-margin account or product should be cut on the strength of a table alone. Some open a sector, anchor a range or support a key line, and those reasons are legitimate as long as they are stated rather than assumed. The allocation method matters here too: change the cost basis and a line can move quadrant, so confirm the ranking under at least one alternative basis before acting on it. Where machine hours, warehouse space or senior staff time are the binding limit, contribution per constrained resource is the safer tiebreaker.
Then model what survives tax. Corporation Tax is 19% on profits up to £50,000 and 25% above £250,000, with marginal relief between those thresholds calculated using the standard fraction of 3/200, as set out in the government's rates and allowances annex. A product generating £100,000 of additional taxable profit does not hand the company £100,000 of distributable value, so show contribution before tax and estimated post-tax contribution side by side for anything that could push the company across a threshold in 2026/27.
Segmented reports by product, division or unit make this workable in practice, and striveX Ltd builds them from a client's accounting software where the data allows.
This article is for informational purposes only and does not constitute professional advice. Tax rules apply as of April 2026. Consult a qualified accountant for your specific circumstances.
Want to see which products and customers are actually paying their way? If your sales are growing but profit is not, contact the striveX team for a no-obligation consultation. Tell us which products, customers or channels you want to understand better, and we can discuss whether segmented management reporting would help you make the next pricing or capacity decision.