

A growing business can be busy, profitable on paper and still short of cash within weeks. That's why a KPI dashboard matters. It isn't a prettier profit and loss account. It's a short monthly control panel where every measure has a target, an owner and a trigger for action.
Why Growing Businesses Need a Focused Monthly Dashboard
Say a distributor turning over £6 million receives a 40 page pack ten days after month end. It lists every ledger code, yet it doesn't say whether cash will cover the next quarter, which customers are paying late or who owns the fix. Decisions arrive late and accountability stays vague.
A useful KPI dashboard solves a narrower problem. It shows the few measures that indicate whether the business is on course, refreshed on a reliable cycle. Each one answers a commercial question and prompts a named response.
The data is usually already there. The UK Business Data Survey 2026 reported that 86% of businesses handled some type of digitised data in 2025 to 2026, yet only 25% of businesses handling digitised data said they analysed it to generate new insights or knowledge.
For a business that has outgrown spreadsheets but can't justify an analytics team, that gap is the opportunity. A focused monthly dashboard turns accounting, sales and operational records into decisions on turnover, margin, cash conversion and delivery. The value isn't more reporting. It's earlier, clearer action.
The Monthly KPI Set and the Action Each Measure Triggers
What should a business KPI dashboard include? Start with three blocks: commercial performance, cash and working capital, and compliance countdowns. Keep the front page short and hold the detail behind it.
Core Monthly KPIs, Calculations and Management Actions
| KPI | Purpose | Calculation | Management action |
|---|---|---|---|
| Turnover against budget | Shows whether sales are on track | Actual turnover ÷ budget turnover × 100 | Re-forecast and review pipeline conversion if below budget for two months |
| Gross margin % | Shows pricing and delivery cost health | Gross profit ÷ turnover × 100 | Analyse pricing, delivery cost and product mix if down 3 percentage points |
| Operating profit margin | Shows overhead control | Operating profit ÷ turnover × 100 | Freeze discretionary overhead if below plan for two months |
| Cash balance and runway | Shows how long current cash will last | Cash balance ÷ average monthly net outflow, in weeks | Refresh the forecast and cut discretionary spend if runway falls below the agreed weeks |
| Debtor days | Shows how quickly customers pay | Trade debtors ÷ turnover × days in period | Start a collections review if 10% above target |
| Stock days | Shows cash tied up in stock | Stock ÷ cost of sales × days in period | Review slow-moving lines and reorder levels if above target |
| Net working capital | Shows cash tied up in trading | Trade debtors + stock minus trade creditors | Agree a cash release plan with named owners |
| Filing countdown to Statutory Accounts | Shows time left before the filing deadline | Nine months from the Year End for a private company | Start year-end adjustments early enough to file on time |
| Corporation Tax payment date | Shows the separate tax deadline | Nine months and one day after the accounting period ends | Forecast the liability and set cash aside before the date |
| VAT registration headroom | Shows proximity to the registration threshold | Rolling 12 month taxable turnover against £90,000, plus 30 day forecast | Register within the required window if the threshold is breached |
Commercial measures show whether growth is profitable. Cash measures show whether that profit is collectible and fundable. Neither block works alone, because strong turnover can still drain cash through slow debtors or excess stock.
Compliance dates belong on the same page. The UK guidance on preparing and filing annual accounts confirms annual accounts are generally due at Companies House nine months after the financial year ends, Corporation Tax is normally payable nine months and one day after the end of the accounting period, and the Company Tax Return is due 12 months after that accounting period ends. Filing accounts doesn't settle tax, so show each date separately.
Working rule: debtor days at 58 against a target of 50 are 16% over target. That's not commentary. It's a collections review this month.
Use monthly management accounts as the reconciled record behind the dashboard. Around seven core measures is enough for most boards, provided each has an owner, a target and a review cadence.
Targets, Variances and Trends
Targets only help when the dashboard shows actual, target, absolute variance, percentage variance, trend and status together. A single month can mislead. A three month trend shows whether a problem is forming.
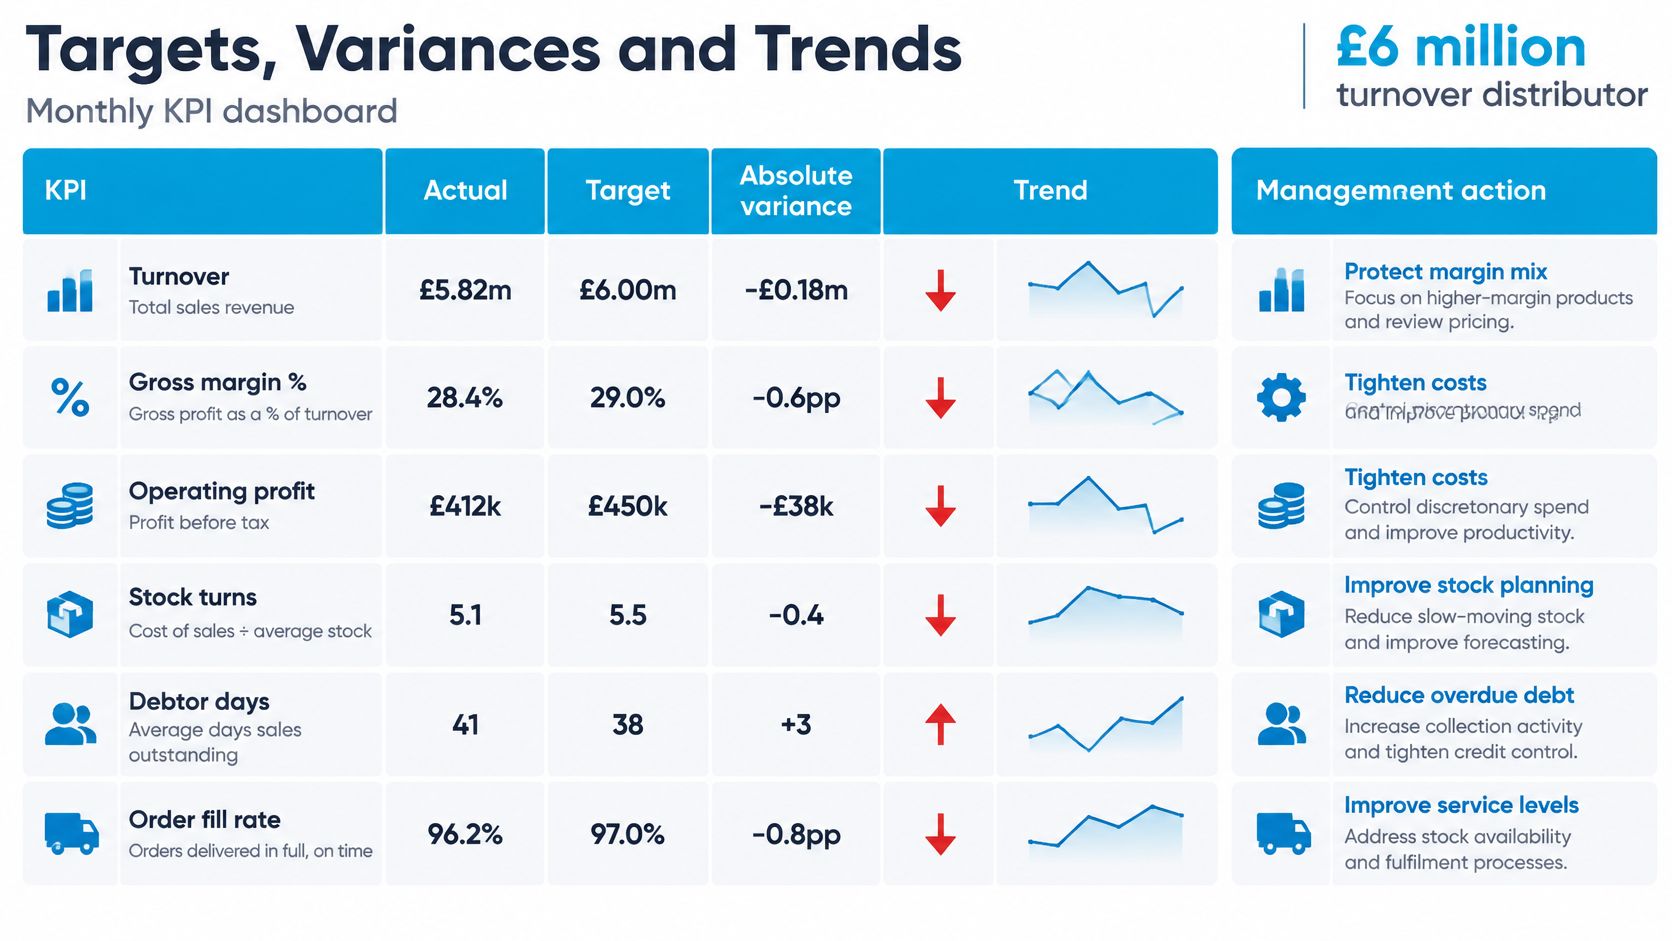
Illustrative Monthly Dashboard for a £6 Million Distributor
| KPI | Target | Variance | Status |
|---|---|---|---|
| Turnover | £500,000 (actual £520,000) | +£20,000 (+4.0%) | On track |
| Gross margin | 40.0% (actual 38.5%) | Minus 1.5 percentage points | Watch |
| Operating profit margin | 10.0% (actual 9.2%) | Minus 0.8 percentage points | Watch |
| Cash balance | £250,000 (actual £275,000) | +£25,000 (+10%) | On track |
| Cash runway | 12 weeks | +2 weeks | On track |
| Debtor days | 50 | +8 days (+16%) | Action |
| Stock days | 45 | +2 days (+4%) | Watch |
| Pipeline conversion | 30% | Minus 3 percentage points | Watch |
Read the rows together. Turnover is £520,000 against £500,000, but gross margin is 38.5% against 40.0%. Growth is arriving at a lower margin, so the question is pricing or product mix, not volume. Debtor days breach the 10% rule, so collections move now. Stock days and pipeline conversion stay on watch unless they deteriorate again.
The UK Government Service Manual on performance metrics states dashboards are objective-focused and support decisions. That principle translates into explicit rules: if debtor days exceed target by 10%, start a collections review, and if gross margin falls by 3 percentage points, analyse pricing, delivery cost and product mix.
Refresh discipline protects trust. Bank and sales activity can update daily, while VAT, PAYE and month-end margin should wait for close procedures. A rolling forecast rather than a fixed annual budget keeps targets relevant when trading changes. The board needs three to five highlighted lines, each with one sentence on cause and corrective action.
Operational Indicators That Warn Before the Numbers Move
Turnover and profit are the rear-view mirror. They confirm what has already happened. Leading indicators are the windscreen, showing what's likely to reach the financial results in the next two or three months.
A sector-neutral set includes:
- Qualified pipeline value: stage-weighted opportunities, not raw enquiries
- Order intake against plan: confirmed demand before invoicing
- On-time delivery: service reliability customers feel first
- Customer repeat rate: retention before turnover softens
- Capacity utilisation: billable or production time already booked
Pair each indicator with the result it predicts. If order intake falls 15% against plan for two months, turnover risk is visible before invoiced sales move. Refresh the forecast, review the sales plan and check whether capacity should be redeployed. Leaders looking to improve efficiency and reduce costs get more value from that early signal than from a detailed explanation after the shortfall lands.
The OECD study of SME technology adoption in the United Kingdom reports UK SMEs perform above EU and OECD averages for cloud computing and data analytics, but adoption of CRM and ERP systems remains more limited, especially among smaller SMEs. Software alone therefore won't fix fragmented data.
Build in stages: define the decision questions, standardise definitions, reconcile sources, automate only stable measures, then review usefulness after each board cycle. Record manual adjustments and name a data owner for every measure. A 13 week cash flow forecast turns those early warnings into a cash view leaders can act on.
How the Right KPI Set Changes by Sector
There's no universal KPI set because the same result means different things in different models. A 25% gross margin can be healthy for a distributor. In professional services, where labour is the main cost, the same figure would point to weak pricing or poor recovery of time.
Keep a shared core of turnover against budget, cash runway and debtor days, then add two or three sector measures.
Sector KPI Scorecard
| Sector | Early-warning measures | Result measures | Typical review action |
|---|---|---|---|
| Professional services | Utilisation, pipeline conversion, work in progress days | Fee recovery rate, debtor days | Re-price or re-resource engagements if utilisation falls below plan |
| Manufacturing | On-time delivery, scrap rate, order backlog | Gross margin, stock days | Review production schedule and supplier lead times when scrap rises |
| Distribution and wholesale | Order fill rate, stock turns, returns rate | Gross margin, debtor days | Adjust reorder levels and check product mix when fill rate drops |
| E-commerce | Conversion rate, customer acquisition cost, return rate | Contribution margin per order, cash from payment processors | Cut or reshape paid marketing when acquisition cost exceeds contribution |
| Construction and contracting | Contract margin to completion, change orders raised, retentions held | Cash position, work in progress | Review contract forecasts and valuation timing when margin to completion slips |
Professional services firms need utilisation and work in progress because unbilled time becomes tomorrow's cash problem. Manufacturers need scrap and delivery because operational waste reaches margin quickly. E-commerce businesses need contribution after marketing and returns, since gross order value can look strong while cash contribution falls.
Drop any measure that hasn't changed a decision in three months. Replace it with one that creates a conversation before month end.
Test the relevant row against the last board pack. If the pack explained results but gave no early warning, the sector measures are missing. If it listed activity without cash or margin, the shared core is too weak.
Telling Useful KPIs From Vanity Metrics
One monthly pack led with invoices raised. Billing volume climbed every month, so the board felt reassured, while overdue balances sat unnoticed in the drill-down. The rebuilt front page swapped it for cash collected against invoices falling due, and the meeting that once reviewed activity started assigning names to the largest unpaid accounts.
That swap is the whole distinction. A vanity metric makes the pack look busy without changing what anyone does next. Total website sessions, gross order value before returns, headcount growth without productivity and unweighted pipeline value all fail the same way: they describe activity rather than whether the activity worked.
Misleading measures are subtler. Turnover growth can hide falling margin. Profit can include a one-off gain. Averages can conceal a wide spread between customers or products. Leaders focused on metrics that drive strategic execution should ask what action follows before accepting any number onto the front page.
The scale should stay tight. The ONS Management and Expectations Survey methodology records that among businesses with 10 or more employees in 2023, approximately one-third monitored one to two KPIs, two-thirds monitored three to nine, and one in ten monitored 10 or more. A working target of five to nine measures fits that pattern.
Useful exceptions prove the rule. VAT headroom looks administrative until it prevents late registration. UK guidance on registering for VAT states a business must register when taxable turnover for the previous 12 months goes over £90,000, or when it expects taxable turnover to exceed £90,000 in the next 30 days. That is a decision with a deadline, so it earns its place.
Every candidate for the front page still goes through the owner, target and trigger test that built the monthly set. When any of the three is missing, the measure stays in the drill-down, where detail supports analysis without competing for the board's attention.
Questions Finance Leaders Ask About KPI Dashboards
How Many KPIs Should a Monthly Dashboard Include
Hold the front page to the five-to-nine range set out earlier. That span covers turnover, margin, cash, working capital and one or two leading indicators, with the rest held in drill-down views. The test is speed. If the leadership team cannot name the three most important movements within a minute of opening the pack, the front page is carrying too much.
Is a KPI Dashboard the Same as Management Accounts
No. Management accounts are the reconciled record of the period: profit and loss, balance sheet, cash flow and variance analysis. The dashboard is the short, forward-looking summary drawn from them, highlighting variances, trends and the action each one triggers. Leaders should reach a decision from the dashboard, then use the full pack to check the detail behind it.
Who Should Own Each KPI
A named person with authority over the result. The sales director owns pipeline conversion, operations owns on-time delivery, and finance owns definitions, data quality and the cash measures. Ownership means explaining the variance and delivering the agreed response each month. Where a measure sits across two teams, split it until one name stands against it.
How Often Should a KPI Dashboard Refresh
Match the refresh to the decision cycle: weekly for cash and debtor positions, monthly for profit and margin, and quarterly for strategic measures such as customer concentration. Refresh faster only where the source data is reliable. A daily margin figure built on incomplete costs creates false precision and erodes trust in the whole dashboard.
Turn Your Financial Data into a Clearer Management Dashboard
Run one month-end cycle with the short scorecard before adding anything. Keep the front page to the measures that trigger action, leave drill-down detail in the pack, and judge the dashboard by whether a variance produced an owner, a decision and a date.
striveX Ltd builds KPI dashboards that track key performance indicators in real time, highlighting trends, exceptions and progress against targets. Its management accounts are produced monthly or quarterly and include profit and loss, balance sheet, cash flow and variance analysis, with narrative commentary explaining the numbers. Monthly and quarterly reporting is provided within one month of the period end, for example March data is provided in April.
Automation should follow that discipline. Where possible, striveX automates report production using the client's accounting software and business intelligence tools; teams weighing that route can compare business intelligence tools before deciding how much automation they need. Once the monthly measures are stable, the same definitions can feed board meeting packs, investor updates and lender reviews.
The practical first step is a KPI dashboard review through the contact page: map current measures against the core set, agree the first monthly scorecard, then extend only when the board is using it.
This article is for informational purposes only and does not constitute professional advice. Tax rules apply as of April 2026. Consult a qualified accountant for your specific circumstances.
Ready to make your monthly numbers more useful? If your board pack shows what happened but not what to do next, get in touch to arrange a no obligation consultation. Tell us where reporting falls short, and we can discuss how KPI dashboards and management accounts could help you spot trends, exceptions and progress against targets.